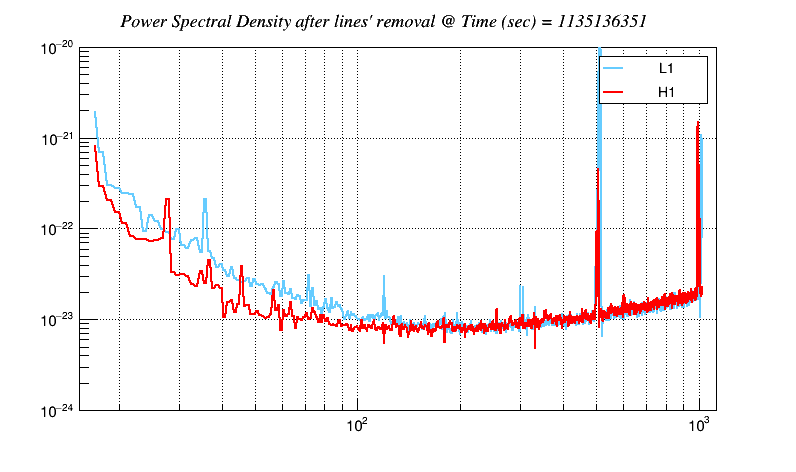
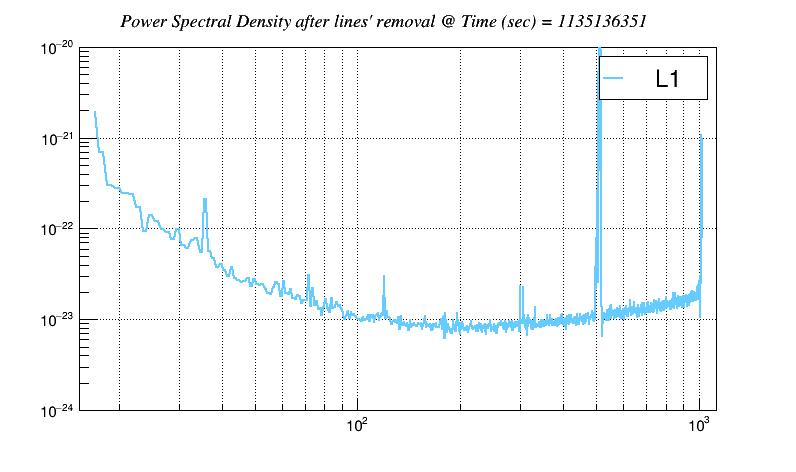
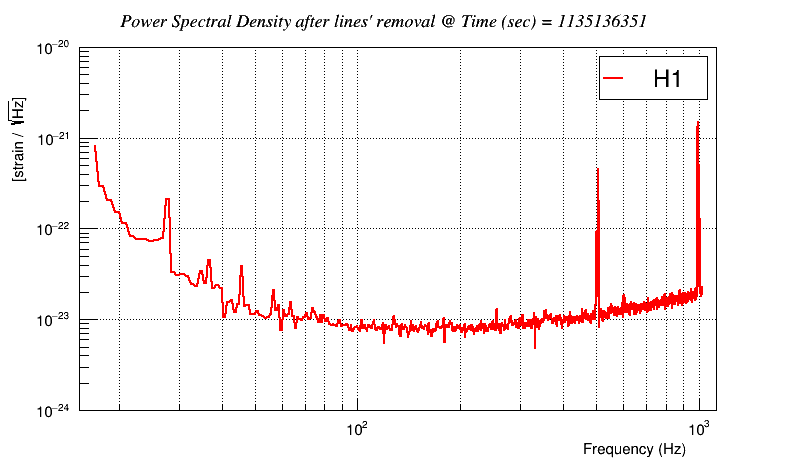
 |
coherent WaveBurst |  |
Event Display |
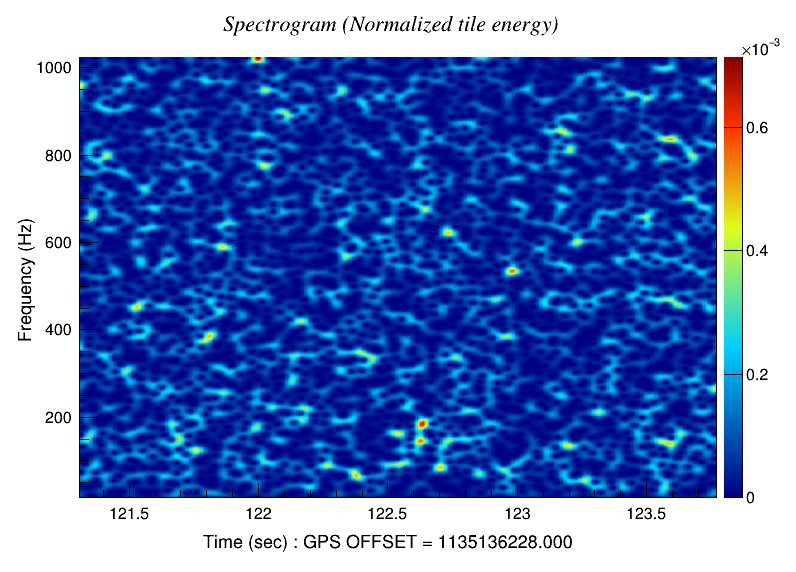
Time-Frequency Maps
L1
| Plot Style: Spectrogram | Spectrogram-Logy | Scalogram | Plot Style: Spectrogram | Spectrogram-Logy | Scalogram |
 |
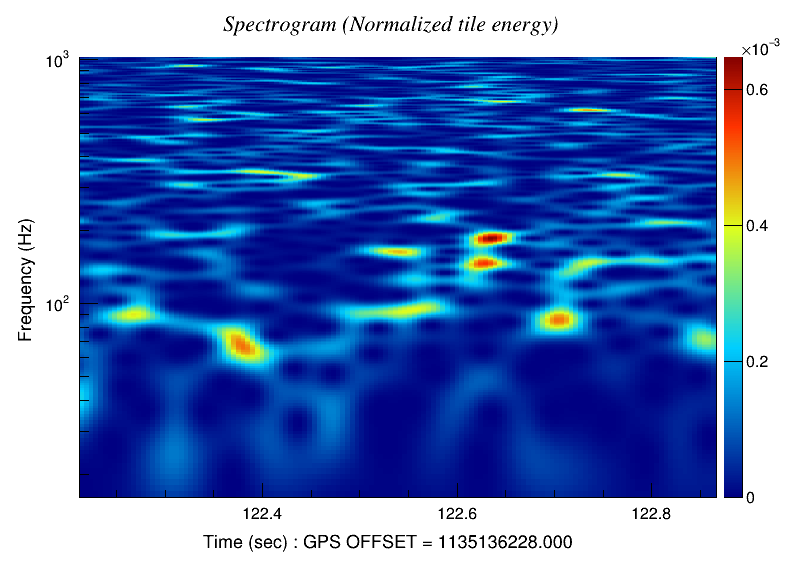 |
| Plot Style: Spectrogram | Spectrogram-Logy | Scalogram | Plot Style: Spectrogram | Spectrogram-Logy | Scalogram |
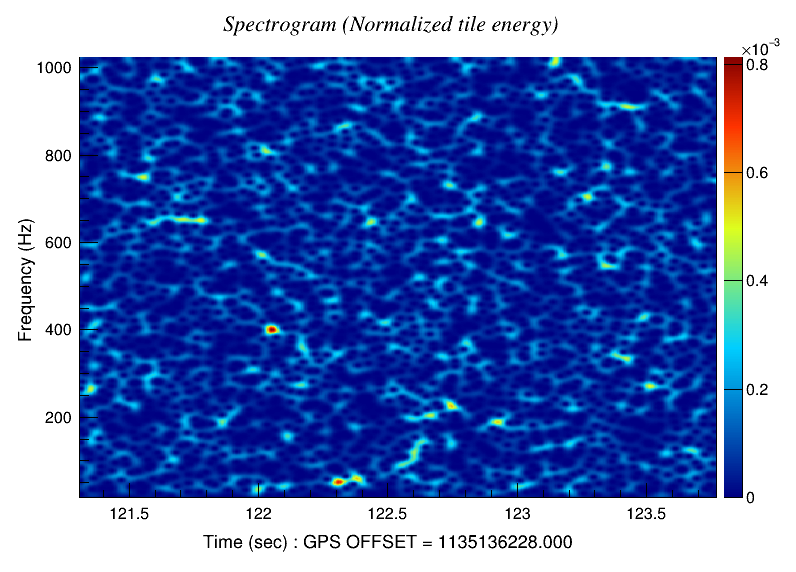 |
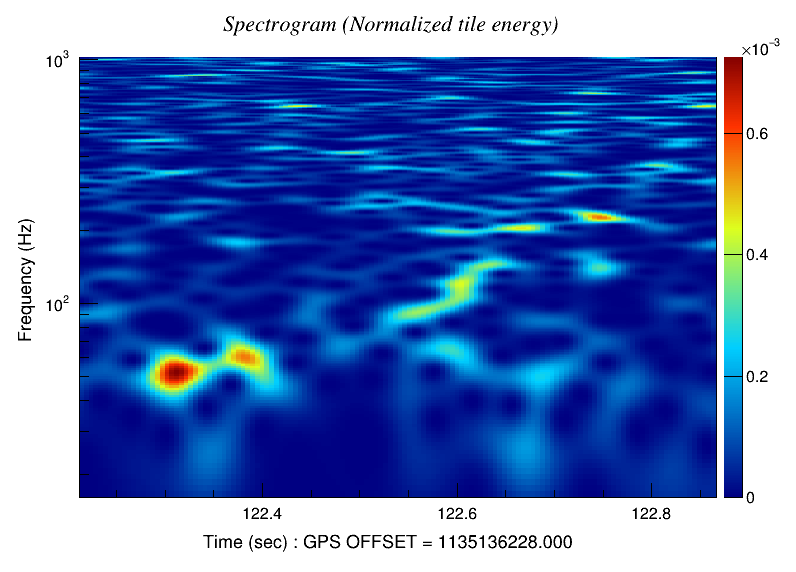 |
Likelihood |
Null |
|---|---|
| Plot Style: Scalogram | mchirp | Plot Style: Scalogram |
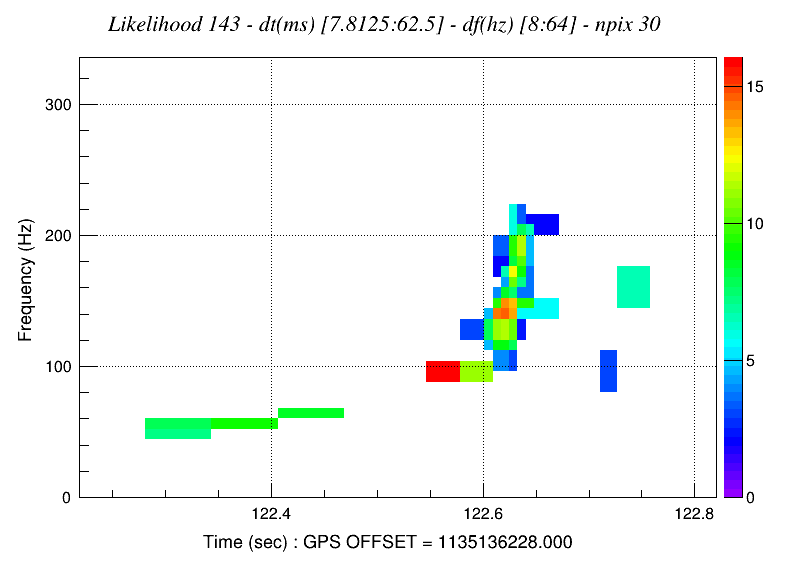 |
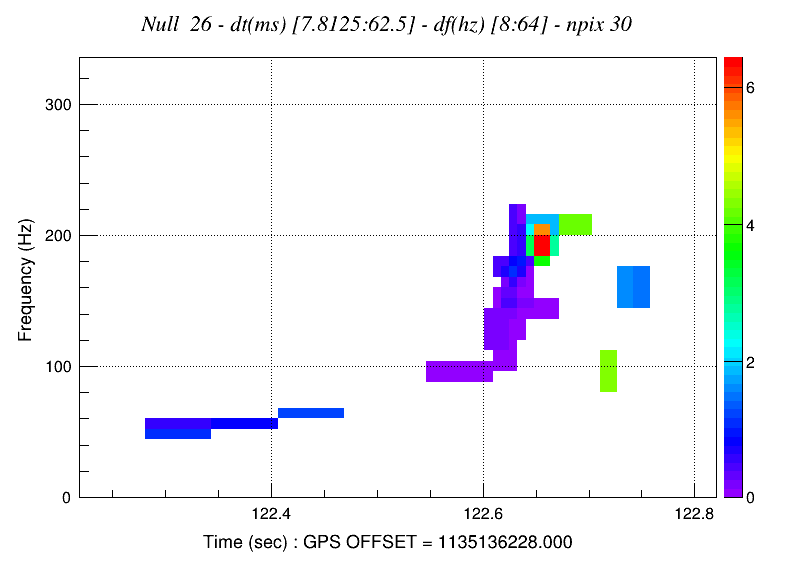 |
Polargrams
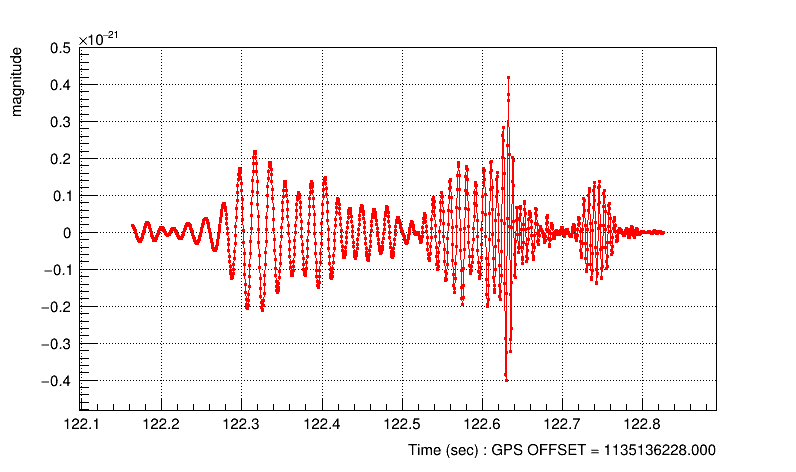
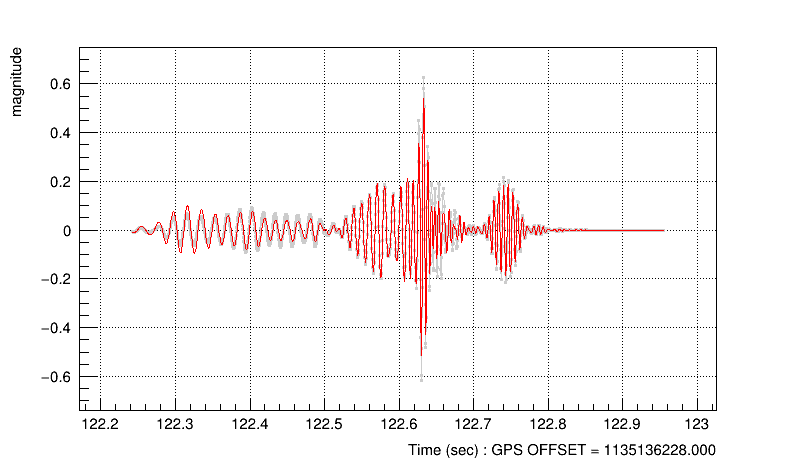
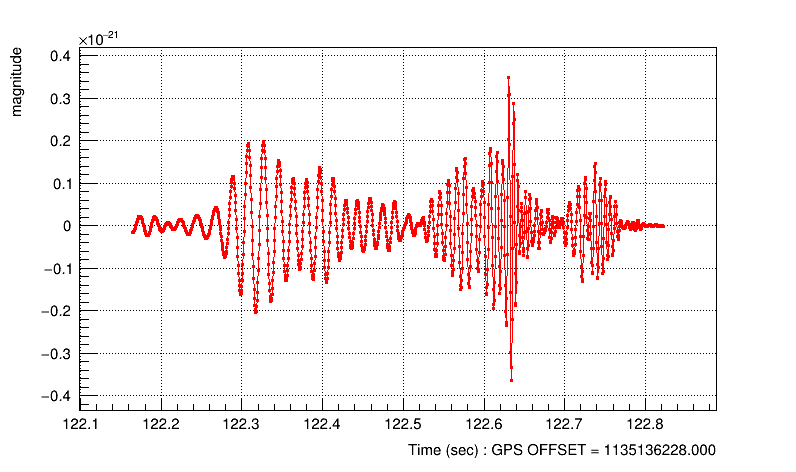
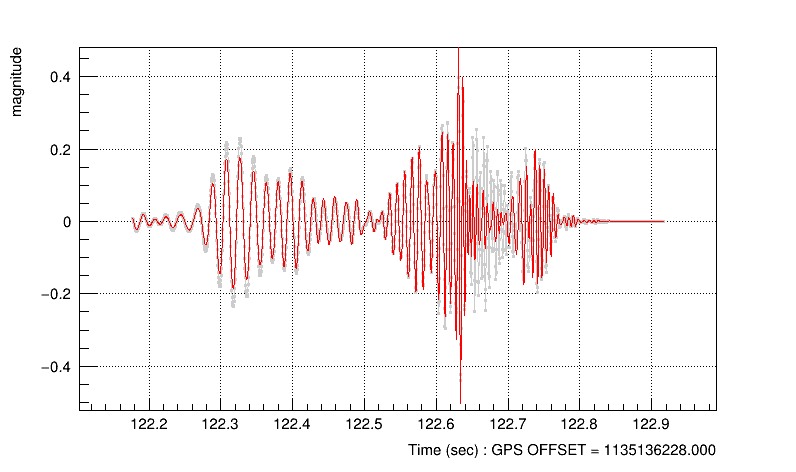
Reconstructed Detector Responses
L1
| Strain: full | zoom | fft | dat | Whitened: Reconstructed Response - Band Limited Output time | fft | dat |
 |
 |
H1
| Strain: full | zoom | fft | dat | Whitened: Reconstructed Response - Band Limited Output time | fft | dat |
 |
 |
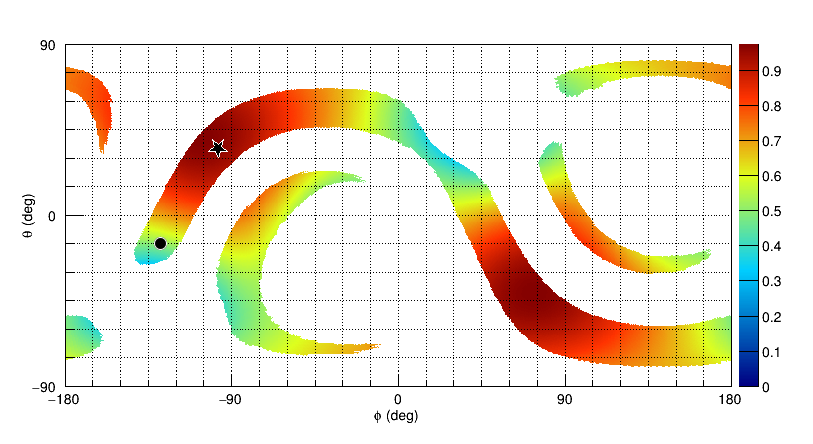
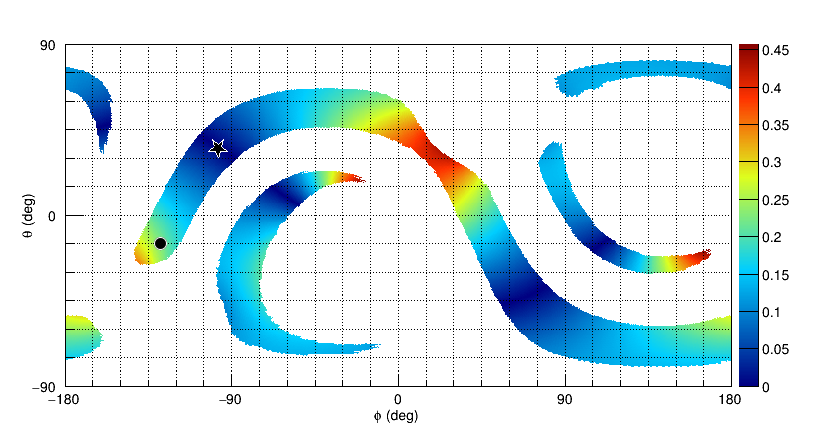
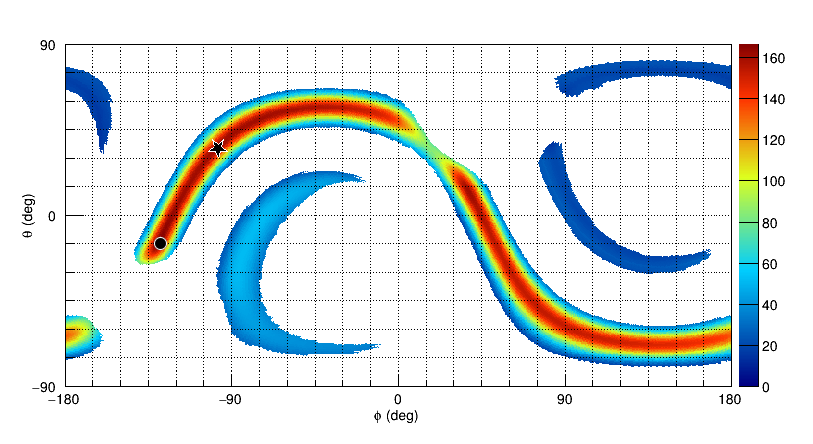
Skymaps
| Sensitivity : Sqrt(F+^2+Fx^2) | Alignment : |Fx|/|F+| |
 |
 |
| Sky Statistic | Circles | skyprobcc | fits | ( aladin | help ) | Detection Statistic |
 |
 |
| Likelihood | Null Energy |
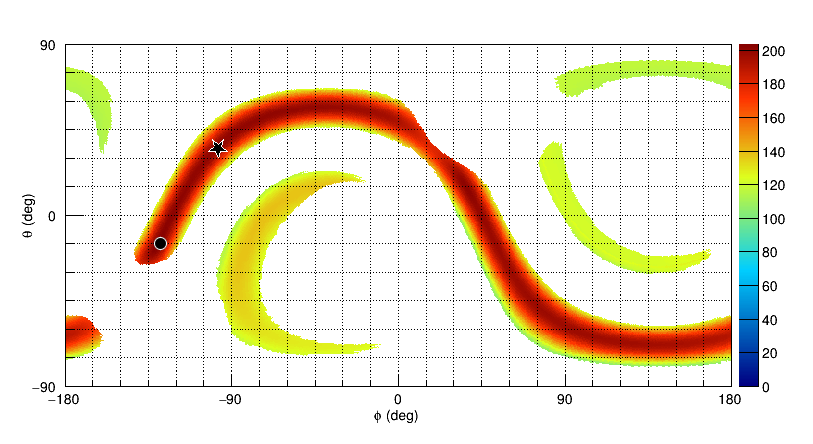 |
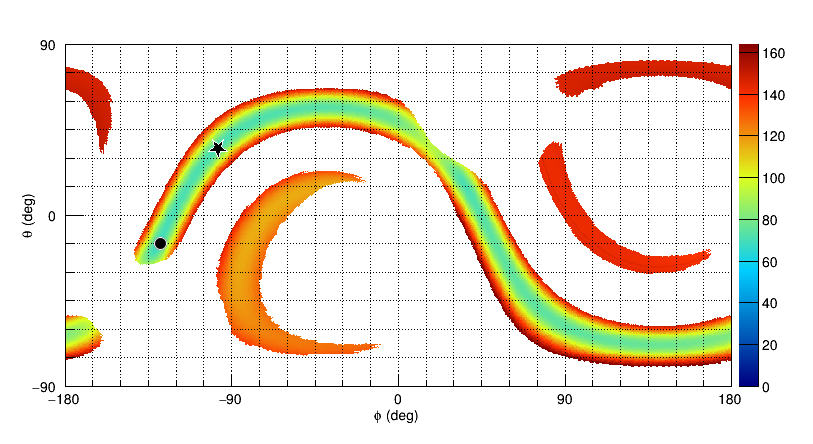 |
| Correlated Energy | Correlation |
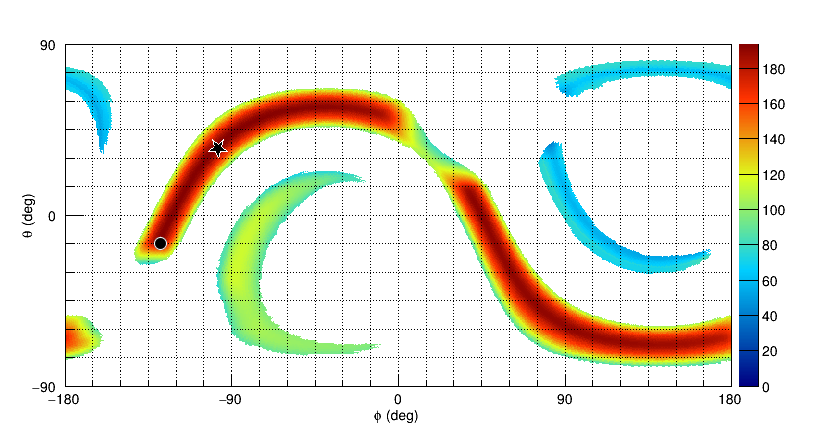 |
 |
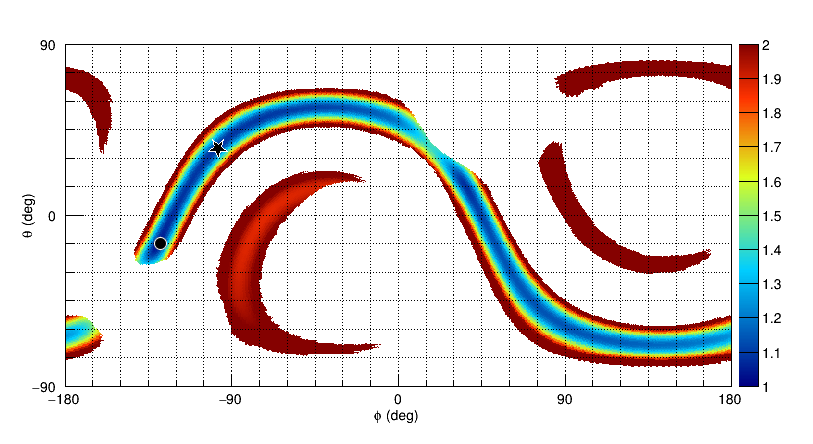
| Likelihood Disbalance | Network Response Index |
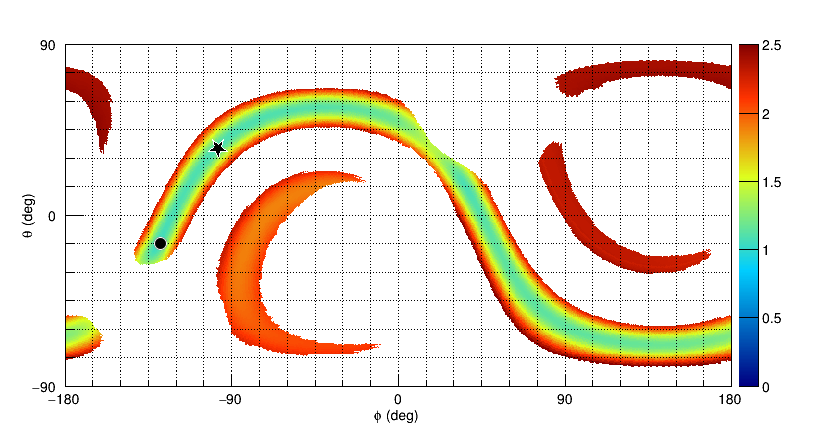 |
 |
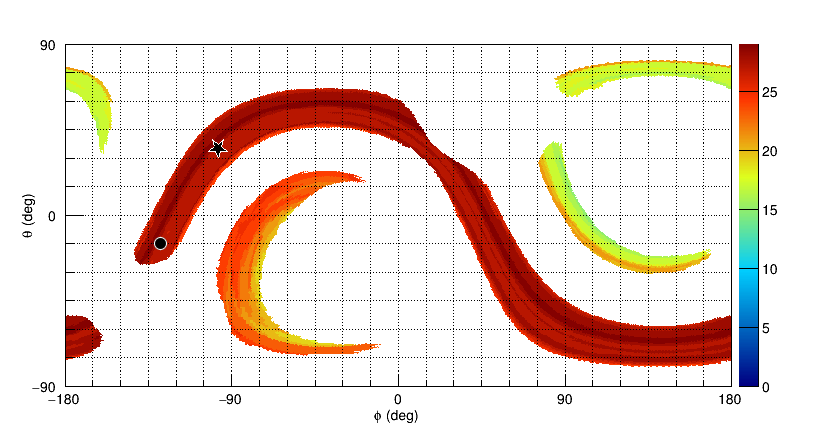
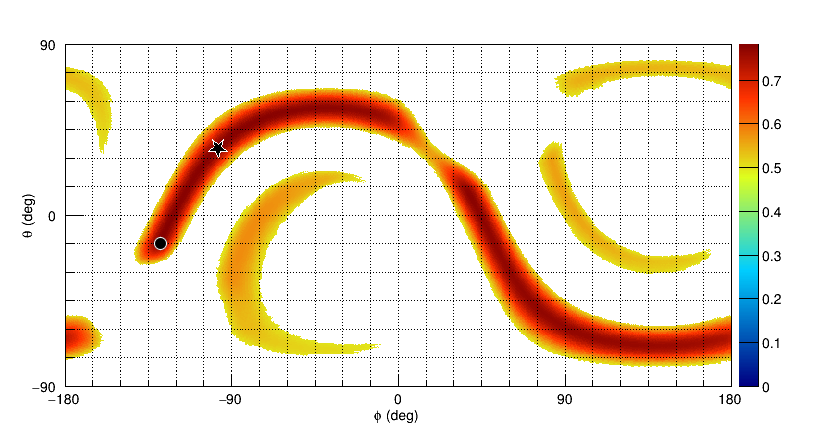
| Polarization | Ellipticity |
 |
 |


