Catalog of Observed Gravitational-wave Mergers
Information about the growing catalog of gravitational-wave mergers can be
accessed through the pycbc.catalog package.
Which mergers do we have information about?
import pycbc.catalog

c = pycbc.catalog.Catalog()

# Names of mergers in the catalog
print(c.names)

# Approximate GPS time of the mergers
print([c[m].time for m in c])
$ python ../examples/catalog/what.py
[u'GW151012', u'GW170608', u'GW170729', u'GW150914', u'GW151226', u'GW170814', u'GW170817', u'GW170104', u'GW170809', u'GW170818', u'GW170823']
[1128678900.4, 1180922494.5, 1185389807.3, 1126259462.4, 1135136350.6, 1186741861.5, 1187008882.4, 1167559936.6, 1186302519.8, 1187058327.1, 1187529256.5]
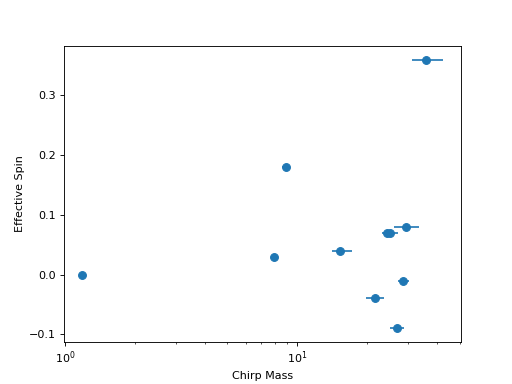
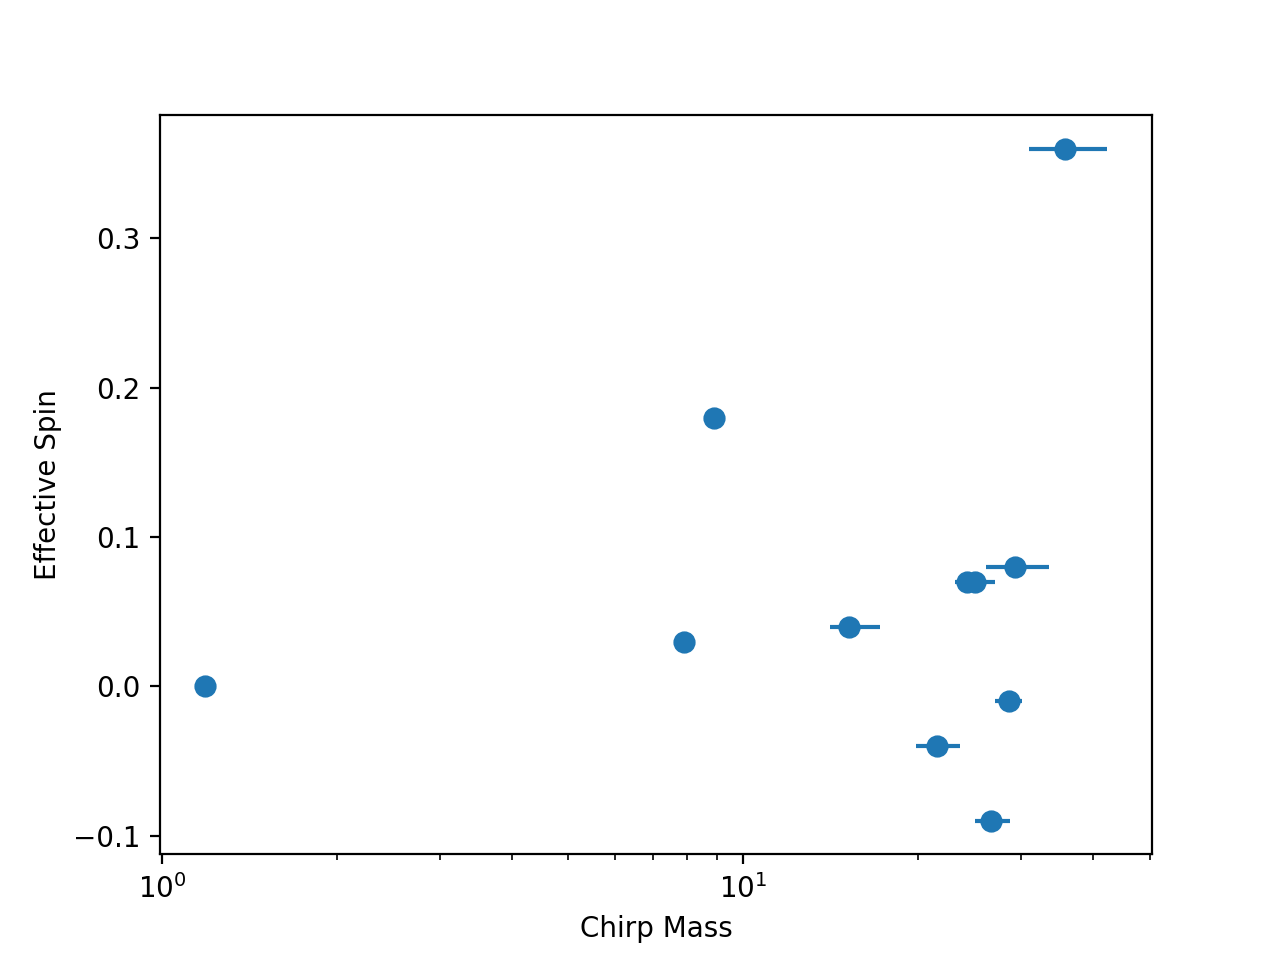
Plotting some key statistics from the catalog
import pycbc.catalog, pylab

c = pycbc.catalog.Catalog()
mchirp, elow, ehigh = c.median1d('mchirp', return_errors=True)
spin = c.median1d('chi_eff')

pylab.errorbar(mchirp, spin, xerr=[-elow, ehigh], fmt='o', markersize=7)
pylab.xlabel('Chirp Mass')
pylab.xscale('log')
pylab.ylabel('Effective Spin')
pylab.show()
(Source code, png, hires.png, pdf)

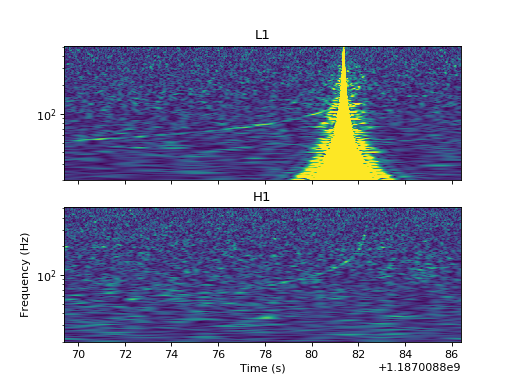
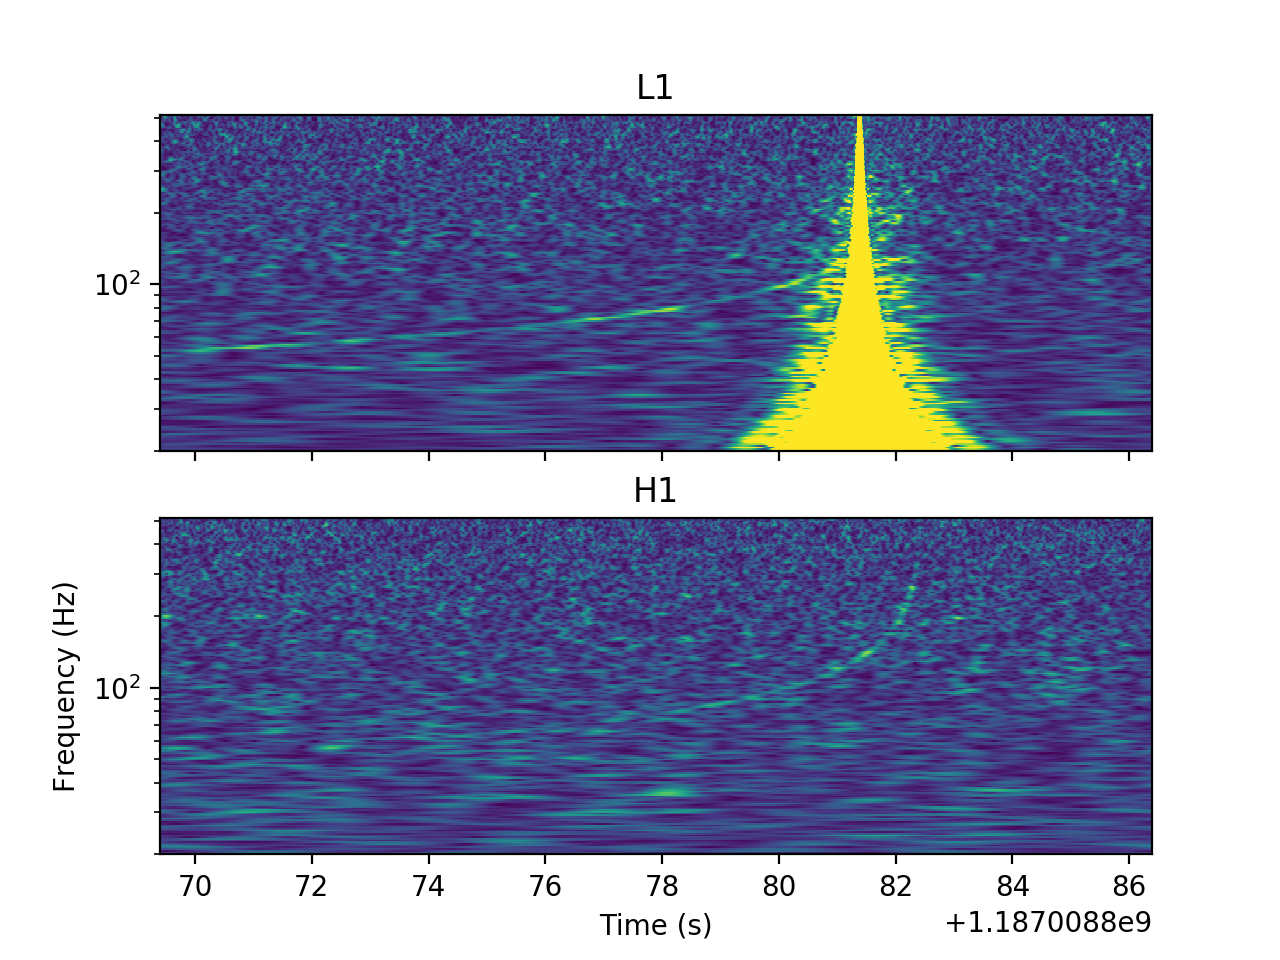
Accessing data around each event
Data around each event can also be easily accessed for any detector.
import pycbc.catalog, pylab

m = pycbc.catalog.Merger("GW170817")

fig, axs = pylab.subplots(2, 1, sharex=True, sharey=True)
for ifo, ax in zip(["L1", "H1"], axs):
    pylab.sca(ax)
    pylab.title(ifo)
    # Retreive data around the BNS merger
    ts = m.strain(ifo).time_slice(m.time - 15, m.time + 6)

    # Whiten the data with a 4s filter
    white = ts.whiten(4, 4)

    times, freqs, power = white.qtransform(.01, logfsteps=200,
                                        qrange=(110, 110),
                                        frange=(20, 512))
    pylab.pcolormesh(times, freqs, power**0.5, vmax=5)

pylab.yscale('log')
pylab.ylabel("Frequency (Hz)")
pylab.xlabel("Time (s)")
pylab.show()
(Source code, png, hires.png, pdf)